To explore the proteoverse,
you’ll need the right tools.

Licensed
· top-down proteomics analysis
· modification identification
· cleavage/truncation identification
· label-free quantitation
· antibody identification
· targeted top-down analysis
· intact mass profiling & quant
· biologics & protein-ligand screening
· proteoform database search
· protein complex analysis
Free
· fragment matching
· fragment map visualization
· Direct Mass Technology™ MS data
processing, visualization, and
analysis
· database management, curation,
and customization
· proteomics result visualization
and reporting
ProSightPD™
Our flagship database search engine for comprehensive analysis of top-down proteomics data.
ProSightPD 4.4 is currently integrated into Thermo Fisher Scientific’s Proteome Discoverer™ (PD). Licensed PD users can upgrade their PD package to include ProSightPD 4.4. To provide more flexibility and affordability to researchers doing only top-down proteomics, we also offer a separate license that allows for use of ProSightPD without the need for a PD license.
key applications
top-down proteomics analysis
Analyze top-down proteomics data using our powerful ProSight database search engine. ProSightPD can flexibly process a wide range of Thermo™ TDMS data— from single proteoform analysis to large, high-throughput top-down proteomics experiments— with speed and precision. A wide range of visualization tools (including TDValidator, ProSight Lite, and TDViewer) and annotation tools (including Database Manager and ProSight Annotator) enable comprehensive data review and analysis.

modification identification
Search modifications with confidence. By using annotated modifications from UniProt™ or custom XML files, ProSightPD assigns only modifications with empirical evidence for their existence. Unknown mass shifts can also be used to account for mass differences and to assign additional fragmentation ions.
cleavage/truncation identification
Look for and identify endogenous cleavages, protein truncations, and clipping products. Cleavage sites can be determined on the N-terminus, C-terminus, or both termini.

label-free proteoform quantitation
Quantitate differences in proteoform abundances across label-free sample types using the Proteome Discoverer™ statistical engine. Sliding window deconvolution with kDecon and Xtract unlocks robust quantitation for proteoform masses, large and small.

antibody identification
Search large mass data such as antibody subunits and intact antibodies using the high mass capabilities of ProSightPD. The kDecon algorithm can determine masses from large proteoforms with unresolved charge state distributions, which can narrow the search range. Integration with ProSight Annotator allows custom sequences and modifications to be annotated and searched.

ProSight Native
More than just native mass spec: Our latest software for protein mass spectrometry includes analysis workflows for intact proteins, targeted top-down, and protein complexes.
ProSight Native is available for purchase directly from us.
key applications
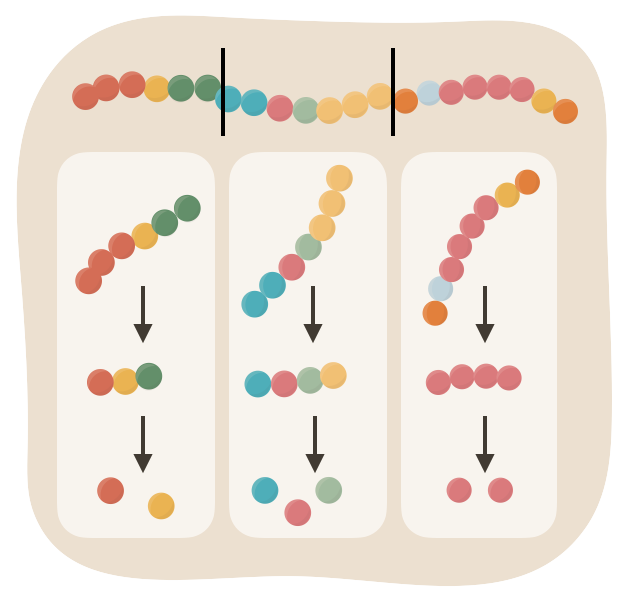
complex-down analysis
Unveil the full composition and stoichiometry of a protein complex using ProSight Native’s unique workflow to analyze each level of a complex-down mass spectrometry experiment:
Intact complex mass analysis
Subunit mass analysis
Subunit fragmentation analysis.
ProSight Native is currently the only software available that can perform all 3 analysis components.

protein complex composition determination
Assess protein complex and subunit masses with mass deconvolution algorithms. ProSight Native integrates our flagship ProSight database search engine, allowing you to then elucidate subunit proteoform identities. The software automatically compiles the data to yield the full stoichiometry of subunits and even non-covalently-bound ligands associated with the complex.
protein mass determination
Determine masses for isotopically-resolved and -unresolved proteins. ProSight Native combines kDecon and THRASH deconvolution for incredibly fast analysis of any size proteins.

proteoform database search
Search proteoform fragmentation data against candidate proteoforms using ProSight search. Candidates are composed of full length or truncated isoform sequences with site-specific post-translational modifications.

top-down mass spectrometry analysis
Perform targeted analysis of a single proteoform or multiple proteoforms. Our TDValidator tool lets you input proteoforms for a single fragment spectrum and match all of the theoretical fragment ions to the spectral data. You can also match precursor ions to precursor spectral data. Fragmentation matching can be performed on data from a wide range of fragmentation techniques, including CID, HCD, ETD, ECD, EThcD, ETciD, and UVPD.

proteoform characterization
Characterize proteoforms using fragmentation evidence. Analyze fragmentation spectra and corresponding matching ions to confidently localize proteoform modifications. TDValidator overlays matching ions from different proteoforms on the same spectra and uses a host of visualization tools and metrics to power in-depth study of proteoforms.

internal fragment ion discovery
Look for internal fragment ions formed during fragmentation processes. The ions can be visualized by color gradient heat map on the fragment map itself. Internal fragment ions can provide additional evidence for modification site localization, increasing confidence in assignments.
modification localization
Assess fragmentation coverage using fragmentation maps and related metrics. Fragmentation ion matches can be validated to confirm post-translational modification site assignments.

ProSight Lite
Our free fragment matching software for single proteoforms.
ProSight Lite is available as a web application or as a Windows desktop application. Read the technical brief on ProSight Lite published in Proteomics.
key applications
fragment matching
Match experimentally-derived fragment ion lists to theoretical fragment ions of a proteoform. A simple, straightforward interface allows modifications to be easily added to the proteoform. Confidence metrics such as a P-score and proteoform characterization score are calculated.

fragment map visualization
Visualize fragmentation matches using fragment flags to show N- and C- terminal fragmentation ions. Fragment flag colors correspond to the type of ion found. Post-translational modifications are color-coded for easy differentiation of modification type.

ProSight Annotator
Our free software for building custom isoform and proteoform databases.
ProSight Annotator is available for free download through the National Resource for Translational and Developmental Proteomics.. Access the technical brief published in Proteomics here.
key applications
database management, curation, & customization
Create and curate UniProt™-formatted XML files using ProSight Annotator’s intuitive user interface, and customize the content of databases you create and search against. Protein sequences can be easily added, removed, or edited with post-translational modifications and other features of interest. The newly annotated XML files can then be used as databases in our ProSight tools. Begin by importing FASTA or UniProt™-formatted XML files.

TDViewer
Our free visualization software for high-throughput top-down proteomics experiments.
TDViewer is available for free download through the National Resource for Translational and Developmental Proteomics.
key applications
proteomics result visualization and reporting
Display protein and proteoform results from a .tdReport. TDViewer allows you to filter results by false discovery rate (FDR) and specific input files. You can also visualize spectra fragmentation maps and Venn diagrams of search results across multiple samples.

Need help with your exploration? Consult with us.
If you’re unsure of what tool would best fit your analysis workflow, don’t hesitate to reach out to us for assistance. We can walk you through our products and help you find the tool that’s right for you.